Click the Green Editorial Tab Above!
Interest Rates Are Moving Up, How Does That Impact You? by PPCLOAN's Steven Kemper..
2017 Q3
Third Quarter 2017
Existing Agents Lead the Way to Higher Values!
| Allstate Agency Price to 12MM Earned Premium Ratio (National Average) | ||||||||||||||||||||||||||||||||||||||||||||||||||||||||||||||||||||||||||||||||||||||||||||||||||||||||||||||||||||||||||||||||||||||||||||||||||||||||||||||||||||||||||||||||||||||||||||||||||||||||||||||||||||||||||||||||||||||||||||||||||||||||||||||||||||||||||||||||||||||||||||||||||||||||||||||||||||||||||||||||||||||||||||||||||||||||||||||||||||||||||||||||||||||||||||||||||||||||||||||||||||||||||||||||||||||||||||||||||||||||||||||||||||||||||||||||||||||||||||||||||||||||||||||||||||||||||||||||||||||||||
|
| Use the arrows to see agency values over time. | prev next |
Allstate Agency values increased in the Third Quarter of 2017 thanks in large part to Existing Allstate Agency Owners purchasing a satellite location. Although the majority of Allstate Agency purchases continue to be executed by Outside Buyers, the mere existence of Existing Agency Owners purchasing a satellite (regardless of their frequency or lack thereof), has been an important part of Allstate Agency values increasing to their current levels. Existing Agents have a long history of paying a larger multiple than Outside Buyers:
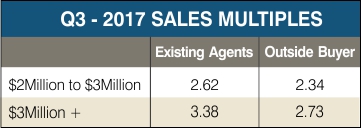
This chart above shows how critical Existing Agents were to the Third Quarter increase in Agency Values. When focusing on the sales multiple of agencies with over $3Million in premium, one quickly notices that Existing Agents paid an average multiple of 3.38 times, whereas Outside Buyers paid a much lower multiple of 2.73 (the same holds true when comparing Existing Agents and Outside Buyers looking to purchase an agency with $2Million to $3Million in Earned Premium). Certainly the graph above demonstrates that Existing Agents pay a higher multiple for agencies, so let’s explore why this might be:
- PURCHASING POWER – Existing Agency Owners have greater purchasing power than Outside Buyers, as Existing Agents are able to leverage the equity in their existing book of business to execute a higher multiple purchase.
- LIMITED PURCHASE WINDOW – Not all agents receive company approval to purchase another location and for those who do receive the blessing from Allstate to acquire, it is typically for a limited time window. So, when the opportunity presents itself, Existing Agents are typically aggressive in their purchase offers as they see the opportunity to increase their premium dollars as too good to pass up.
- KNOWN COMMODITY – For existing agents purchasing another Allstate Agency, they know what they are getting themselves into. Existing Agents typically have the infrastructure set up to handle the additional customers and they know what it takes to be successful. If the opportunity wasn’t great, Existing Agents wouldn’t execute the purchase.
From a seller’s perspective, it is certainly preferable to sell your business to an Existing Agency Owner. In most instances, you will receive a higher multiple for your business along with more cash at closing. Additionally, selling to an Existing Agency Owner typically eliminates the need for seller financing, or it greatly reduces the risk associated with taking back a seller note for your purchaser. Certainly, any level of seller financing caries risk, however there is a big difference between being asked to seller carry $100,000 of your purchase price for an Existing Agency Owner, versus being asked to seller finance $300,000 or more of your agency’s purchase price for an Outside Buyer.
$0 to $100,000 in New/Renewal Commission
All agencies financed in this size group by PPC LOAN in the Third Quarter of 2017 were part of a merger transaction.
$100,000 to $200,000 in New/Renewal Commission
Allstate agencies in this size group experienced a big jump in value, primarily due to 33% of the agencies in this size group being part of a merger transaction. Outside Buyers who were awarded the opportunity to reach “scale” through a merger of multiple smaller sized agencies have historically paid a higher multiple. This quarter was no different, as those Allstate Agencies in this size group purchased as part of a merger were sold for an average multiple of 2.71 times. All other agencies in this size group that sold as a standalone agency were purchased at a multiple of 2.29 times.
$200,000 to $300,000 in New/Renewal Commission
Only 21% of Agencies transitioned this Quarter had Earned Premium ranging from $2 Million to $3 Million. Despite this fact, these sized Allstate Agencies continue to be the most steady of all size groups, consistently maintaining a value multiple in the range of 2.3 to 2.5 times over the past three years. Based on this track record, it is no surprise that during the Third Quarter of 2017, Agencies of this size have realized an increase in value increasing from a 2.31 multiple in the Second Quarter to a multiple of 2.45 times this Quarter.
No merger transactions occurred in this size group, however the multiple paid by Existing Agency Owners purchasing a satellite for these sized agencies was instrumental in this categories growth in value (please reference the chart above for validation of this statement).
$300,000+ in New/Renewal Commission
In the First Quarter of 2017, Allstate agencies in this size group realized a five Quarter high trading at an average sales multiple of 2.82. This Quarter the largest sized agency group exceeded this multiple realizing an average sales multiple of 2.84 times. This can greatly be attributed to existing agents paying on average 3.38 times for agencies with over $3 Million in Earned Premium.
| Percentage of Agency Sales by Size Group | ||||||||||||||||||||||||||||||||||||||||||||||||||||||||||||||||||||||||||||||||||||||||||||||||||||||||||||||||||||||||||||||||||||||||||||||||||||||||||||||||||||||||||||||||||||||||||||||||||||||||||||||||||||||||||||||
|
| Use the arrows to see agency values over time. | prev next |
Buy/Sell market in the Third Quarter of 2017 was dominated by agencies with over $2 million in Premium, with agencies over $2 Million in Premium representing 71% of agencies sold.
| Allstate Agency Value Ratios | ||||||||||||||||||||||||||||||||||||||||||||||||||||||||||||||||||||||||||||||||||||||||||||||||||||||||||||||||||||||||||||||||||||||
|
| Use the arrows to see agency values over time. | prev next |
For those Agency Owners residing in a state where a good portion of the homeowners insurance is written through a third party brokerage company (primarily coastal counties), looking at the multiple of revenues may be your best measuring stick for agency value as it takes into consideration both Allstate and brokered (i.e. non-Allstate) revenues. Certainly, the brokerage book is a reliable source of renewal income and has a level of value that is not presented in the traditional multiple applicable to Allstate commissions.