Click the Green Editorial Tab Above!
Interest Rates Are Moving Up, How Does That Impact You? by PPCLOAN's Steven Kemper..
2017 Q2
Second Quarter 2017
Agency Values Experience Small Second Quarter Correction
Slight tweaks to Allstate’s onboarding requirements, matched with minimal merger activity and fewer Existing Agency Owners consummating agency purchases, have reduced the pool of approved buyers in the Second Quarter of 2017. This reduction in the approved buyer pool has resulted in fewer competitive purchase offers being made on those Allstate Agencies listed for sale, which has caused a slight reduction in Allstate Agency Values this quarter.
The Allstate Agency Value Index has reported on many occasions that the supply of approved buyers has a great impact on the value of Allstate Agencies. In fact, as recently as the Third Quarter of 2016, the AAVI headline read “Values Remain Strong Thanks to Mergers and Existing Agents Purchasing Satellites.” The premise was that the inclusion of some level of Existing Agency purchasers, and the option for Outside Buyers to purchase and merger multiple smaller-sized agencies proved to be very healthy for Allstate Agency values. In fact, healthy competition on the buy side is good for both sellers of Allstate agencies and Agency values. Simply put, fewer approved buyers in the Second Quarter of 2017 was a contributing factor for the reduction in Allstate Agency values.
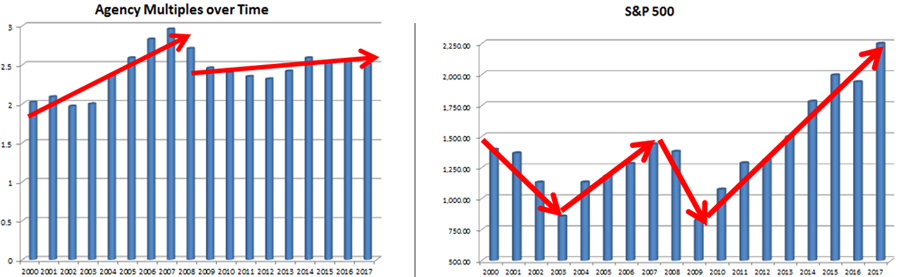
| Allstate Agency Price to 12MM Earned Premium Ratio (National Average) | ||||||||||||||||||||||||||||||||||||||||||||||||||||||||||||||||||||||||||||||||||||||||||||||||||||||||||||||||||||||||||||||||||||||||||||||||||||||||||||||||||||||||||||||||||||||||||||||||||||||||||||||||||||||||||||||||||||||||||||||||||||||||||||||||||||||||||||||||||||||||||||||||||||||||||||||||||||||||||||||||||||||||||||||||||||||||||||||||||||||||||||||||||||||||||||||||||||||||||||||||||||||||||||||||||||||||||||||||||||||||||||||||||||||||||||||||||||||||||||||||||||||||||||||||||||||||||||||||
|
| Use the arrows to see agency values over time. | prev next |
Despite a reduction in the simple average multiple from 2.61 in the First Quarter to 2.39 in the Second Quarter of 2017, the individual size groups realized minimal reductions as discussed below:
$0 to $100,000 in New/Renewal Commission
No agencies were financed in this size group by PPC LOAN in the Second Quarter of 2017. This is due to the minimal amount of merger activity experienced during this time period.
$100,000 to $200,000 in New/Renewal Commission
Agencies in this size group realized a decrease in their sales multiple from 2.21 times in the First Quarter of the year to 2.09 times in the Second Quarter. Excluding those agencies that were part of a merger transaction, the multiple for these sized agencies selling as a stand-alone operation to an Outside Buyer was just 1.99 times, while the average multiple of agencies in this size group that were part of a merger transaction was 2.38.
With the change to ECP from a modified ADB compensation model (NOBIT), one would expect agencies in this size group (focusing on agencies with less than $1.5Million in Earned Premium) to struggle from a value perspective absent any merger opportunity. With ECP, the timeline for receiving enhanced commissions was reduced relative to NOBIT, in some cases significantly. Accessibility to fewer enhanced commissions over a shorter amount of time could impact an agent’s ability to grow to scale, which eventually could reduce demand for these size agencies.
$200,000 to $300,000 in New/Renewal Commission
47% of Agencies transitioned this Quarter had Earned Premium ranging from $2 Million to $3 Million. This size group has historically been the most steady of all size groups, consistently maintaining a value multiple in the range of 2.3 to 2.5 times over the past three years. Based on this track record, it is no surprise that during the Second Quarter of 2017, Agencies of this size have realized the smallest dip in value dropping from a 2.33 multiple in the First Quarter to a multiple of 2.31 this Quarter.
$300,000+ in New/Renewal Commission
Agencies in this size group realized a five Quarter high in the First Quarter of the year with an average sales multiple of 2.82. This was most recently eclipsed during the 4th Quarter of 2015, when a multiple of 2.91 was realized for these largest sized agencies. The Second Quarter result of 2.71 times is well within historical averages and represents a very healthy multiple for these largest sized agencies.
| Percentage of Agency Sales by Size Group | |||||||||||||||||||||||||||||||||||||||||||||||||||||||||||||||||||||||||||||||||||||||||||||||||||||||||||||||||||||||||||||||||||||||||||||||||||||||||||||||||||||||||||||||||||||||||||||||||||||||||||||||||||||||||
|
| Use the arrows to see agency values over time. | prev next |
The Buy/Sell market in the Second Quarter of 2017 was dominated by agencies with over $2 million in Premium, with agencies over $2 Million in Premium representing 79% of agencies sold.
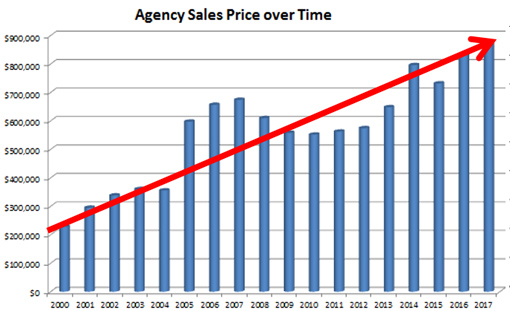
| Allstate Agency Value Ratios | |||||||||||||||||||||||||||||||||||||||||||||||||||||||||||||||||||||||||||||||||||||||||||||||||||||||||||||||||||||||||||||||||||
|
| Use the arrows to see agency values over time. | prev next |
For those Agency Owners residing in a state where a good portion of the homeowners insurance is written through a third party brokerage company (primarily coastal counties), looking at the multiple of revenues may be your best measuring stick for agency value as it takes into consideration both Allstate and brokered (i.e. non-Allstate) revenues. Certainly, the brokerage book is a reliable source of renewal income and has a level of value that is not presented in the traditional multiple applicable to Allstate commissions..
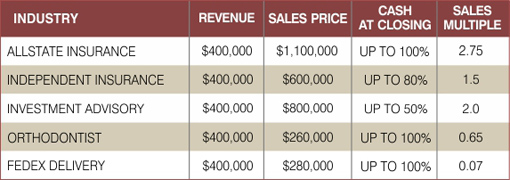 By competition, I'm comparing ownership of an Allstate Insurance agency to other small business ownership opportunities. Whether you own an insurance agency, investment advisory firm, FedEx delivery routes or a dental practice, at some point the owner will want to exit the business and sell their asset for as much as they can get. Not only do Allstate Agents on average sell their business for a larger multiple of revenues, they typically will receive the greatest percentage of sales proceeds at closing.