Click the Green Editorial Tab Above!
Interest Rates Are Moving Up, How Does That Impact You? by PPCLOAN's Steven Kemper..
2016 Q2
Second Quarter 2016
Large Agency Sales Spark Increase in Agency Values
The Second Quarter of 2016 boasts the largest number of agencies with over $5 million in Earned Premium transitioned since the Second Quarter of 2010. This surge in larger sized agency sales dramatically increased the simple average multiple from 2.35 times in the First Quarter of the year to 2.59 times in the current Quarter.
| Allstate Agency Price to 12MM Earned Premium Ratio (National Average) | ||||||||||||||||||||||||||||||||||||||||||||||||||||||||||||||||||||||||||||||||||||||||||||||||||||||||||||||||||||||||||||||||||||||||||||||||||||||||||||||||||||||||||||||||||||||||||||||||||||||||||||||||||||||||||||||||||||||||||||||||||||||||||||||||||||||||||||||||||||||||||||||||||||||||||||||||||||||||||||||||||||||||||||||||||||||||||||||||||||||||||||||||||||||||||||||||||||||||||||||||||||||||||||||||||||||||||||||||||||||||||||||||||||||||||||||
|
| Use the arrows to see agency values over time. | prev next |
Existing Agents Buying Big
Forty-three percent of agencies with over $5 million in Earned Premium that transitioned in the Second Quarter of 2016 were sold to an existing agency owner. Existing agency owners paid an average of 3.38 times to execute these large-sized purchases, while Outside Buyers paid an average multiple of 3.10 times for greater than $5Million in Earned Premium.
As has been stated in previous editions of the AAVI, existing agency owners typically possess greater purchasing power than Outside Buyers depending on the level of equity they hold in their existing agencies. In fact, the Third Quarter edition of the AAVI in 2014 noted two key concepts that are occurring in the Second Quarter of 2016. These two concepts from 2014 are listed below:
- “Many Existing Allstate Agency Owners around the country have voiced their desire for ownership of additional Allstate premium dollars. This significant desire to own additional Premium dollars is now an opportunity many top performing agents can execute on, and they are viewing the opportunity as “too good to pass up.” As a result, existing Allstate agents are making aggressive purchase offers when a quality buying opportunity presents itself….”
- “Beyond just their desire to purchase additional premium dollars, existing Allstate Agency Owners are in a unique buying position as they simply are able to pay more for a purchase than your typical outside buyer. Utilizing the equity in their existing agency contributes to an agent’s purchasing power, something an Outside Buyer does not have at his or her disposal.
In most instances, an existing Allstate agency owner is providing for their personal living needs from the cash flow of their existing agency, and any profits from a satellite purchase simply represents “gravy.” This is not the case with Outside Buyers, as they typically need every dollar of cash flow to support their personal living obligations and pay business overhead, along with business purchase loan payments.”
As noted above, the two main themes from the 2014 Third Quarter AAVI are both prevalent today, as (1) Existing Agency Owners are executing a purchase that they view as “too good to pass up”, and (2) they are also utilizing equity in their existing agency to maximize their purchasing power. Both of these factors certainly contributed to the solid values realized in the Second Quarter of 2016 – specifically for agencies with over $5 million in Earned Premium.
Size Matters to Value Well Beyond $3Million in Earned Premium
With an increased number of larger-sized agencies transitioning this Quarter, it is worthwhile to take a deeper look at the multiples those agencies with over $4 million and $5 million in Earned Premium garnered during the Second Quarter of 2016:
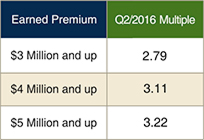
As you can see, agencies with $3 million in Earned Premium command a solid value; however, as agency Premium grows, the value of the agency continues to increase. For those not yet at scale, this chart can only serve to strengthen the argument for reinvesting free cash flow into the business for growth purposes.
Why is the market paying a higher multiple for larger sized agencies? One explanation might be that buyers of the largest-sized agencies are able to take a long-term view of their investment as the abundance of cash flow they have at their disposal allows them to weather the usual ups and downs of the insurance industry that occur over time.
Smaller-sized agencies (those with revenues less than $200,000) are focused on the here and now (a short-term view) where covering the costs of business overhead along with personal owner salary leaves minimal cash flow for growth investment and marketing. Having peace of mind when purchasing a larger-sized agency as to the certainty of cash flow has allowed both existing agency owners and Outside Buyers to pay a multiple of greater than 3.0 times and do so comfortably while realizing business success.
Smaller Sized Groups Values Stable in Q2
Those agencies with less than $3 million in Earned Premium saw nominal increases in value, which is a good sign coming off of recent value drops. It is certainly worth noting that agencies with between $200,000 and $300,000 commission income realized a value of 2.51 times this Quarter, eclipsing the 2.50 times threshold for the first time in three quarters.
| Percentage of Agency Sales by Size Group | |||||||||||||||||||||||||||||||||||||||||||||||||||||||||||||||||||||||||||||||||||||||||||||||||||||||||||||||||||||||||||||||||||||||||||||||||||||||||||||||||||||||||||||||||||||||||||||||||||||
|
| Use the arrows to see agency values over time. | prev next |
The Second Quarter of 2016 saw a large number of agencies with over $3 million in Premium sell (51%), with agencies over $4 Million in Premium representing 50% of this size group. Fewer ADB qualifying agencies were financed in the Second Quarter, and it will be interesting to watch going forward if this becomes a trend.
| Allstate Agency Value Ratios | |||||||||||||||||||||||||||||||||||||||||||||||||||||||||||||||||||||||||||||||||||||||||||||||||||||||||||||||||||||||
|
| Use the arrows to see agency values over time. | prev next |
For those Agency Owners residing in a state where a good portion of the homeowners insurance is written through a third party brokerage company (primarily coastal counties), looking at the multiple of revenues may be your best measuring stick for agency value as it takes into consideration both Allstate and brokered (i.e. non-Allstate) revenues. Certainly, the brokerage book is a reliable source of renewal income and has a level of value that is not presented in the traditional multiple applicable to Allstate commissions.