Click the Green Editorial Tab Above!
Interest Rates Are Moving Up, How Does That Impact You? by PPCLOAN's Steven Kemper..
2015 Q3
Third Quarter 2015
Large Agency Values Hit 7-Year High / Small Agency Values Decrease
In reviewing the Third Quarter 2015 Allstate Agency Value Index results there are two points of interest which require further discussion:
- The value of agencies under $2Million in Earned Premium dropped significantly.
- The value of agencies with over $2Million in Earned Premium spiked significantly, hitting a high not seen since 2008.
| Allstate Agency Price to 12MM Earned Premium Ratio (National Average) | ||||||||||||||||||||||||||||||||||||||||||||||||||||||||||||||||||||||||||||||||||||||||||||||||||||||||||||||||||||||||||||||||||||||||||||||||||||||||||||||||||||||||||||||||||||||||||||||||||||||||||||||||||||||||||||||||||||||||||||||||||||||||||||||||||||||||||||||||||||||||||||||||||||||||||||||||||||||||||||||||||||||||||||||||||||||||||||||||||||||||||||||||||||||||||||||||||||||||||||||||||||||||||||||||||||||
|
| Use the arrows to see agency values over time. | prev next |
1. The Value of Agencies Under $2Million in Earned Premium Dropped Significantly:
Before we look at the cause of this decrease for smaller sized agencies, let’s review the demographics of the agencies PPC LOAN financed in the Third Quarter with Earned Premium under $2Million:
- 63% of agencies with less than $2Million in EP did qualify for ADB
- 37% of agencies under $2Million in EP did not qualify for ADB
ADB Qualifying Agencies Sell for 2.23 Times
Agencies that qualified for ADB represented 63% of the small sized agencies PPC LOAN financed in the Third Quarter of 2015 (agencies with less than $1.5Million in Earned Premium). These ADB qualifying agencies sold for an average multiple of 2.23 times, well above the overall average for this size group. Certainly, the value received by Allstate agency Buyers participating in the ADB program is substantial, and a portion of this value translated into a higher multiple for agency sellers who are transitioning an agency that will qualify for ADB.
| AGENCY DEVELOPMENT BONUS (ADB) | |
| ADB offers a lucrative bonus payment system which pays a commission rate to new agents of up to 43% for new business written. Any agent doing a scratch start-up all the way up to purchasing a $750,000 Earned Premium agency qualifies for the full ADB dollars. Purchasing $750,001 to $1.5 million in Earned Premium qualifies for 80% of ADB and provides significant additional cash flow that can be used to reinvest in agency growth. |
Non ADB Qualifying Small Sized Agencies Sell for 1.46 Times
On the flip side, those agencies with under $2Million in Earned Premium, but not qualifying for ADB sold for a multiple of just 1.46 times in the Third Quarter of 2015. Based on these results, it is easy to conclude that agency Buyers have a strong preference to purchase a small sized agency with one caveat: if they can participate in the Agency Development Bonus program.
The Odd Duck ($1,500,001 to $1,999,999 in Earned Premium)
Those small agency sellers hit the hardest in the Third Quarter with regard to the value were those selling an agency with Earned Premium between $1,500,001 and $1,999,999. These agencies do not qualify for ADB, and rightly or wrongly the market of Allstate agency Buyers has determined two things about these odd sized agencies that narrowly miss qualifying for ADB:
- If I don’t grow this sized agency I won’t make much money
A business that has $160,000 in top-line revenues prior to paying staffing costs, advertising, rent, and insurance among other necessary business operating costs will not be very profitable on paper and will require revenue growth for the business owner to feel good about their investment.
- It’s hard to grow this sized agency without cash flow assistance
As mentioned above, these odd sized agencies don’t quite have the cash flow (assuming a 10% new & renewal commission rate) to aggressively pursue growth from the cash flow of the business. Absent ADB monies, growth of these sized agencies will need to be achieved through infusing personal savings into the business or borrowing working capital. This realization by approved agency Buyers is certainly a driving factor in the low multiples these Odd Duck agencies are selling for.
The ADB program was designed to infuse capital into those Allstate Agency businesses operating with thin margins or negative cash flow. My observation is that this program has been successful in yielding premium growth for both Allstate Insurance Co. and agency owners alike. I cannot make a statement as to how profitable this program has been for Allstate Insurance Co., but it certainly has led to significant premium growth for both scratch start-up agents and small agency Buyers alike.
Based on my long tenured participation in the Allstate market and my continued observance of Allstate Values and cash flow I believe Allstate Insurance would be wise to consider offering some level of ADB to those agencies with $1,500,001 to $1,999,999 in Earned Premium.
How is Regional Management Handling these “Odd Ducks?”
The evidence shows support for my labeling of these sized agencies as “Odd Ducks.” In fact, almost every region in the country agrees with me as they continue to execute “split book” transactions for agencies with Earned Premium of $1,500,001 to $1,999,999, to ensure the Buyer(s) qualify for ADB. Splitting books into strategic slices is the best way for regional management to incentivize agency purchase to join the ranks at Allstate Insurance Co. by providing them an opportunity that qualifies for ADB.
In the First Quarter of 2015 Allstate Agency Value Index I used the example of a $1,957,000 Earned Premium agency that was split to allow the buyer to participate in ADB. Despite stronger cash flow for the Buyer, “Split Books” transactions require the nuisance of finding two Buyers and having to negotiate two separate sale prices and two separate purchase agreements. If agencies sold with $1,500,001 to $1,999,999 in Earned Premium were approved in some capacity to participate in the ADB program, I strongly believe it would eliminate the need for split book transactions (and the hassle of two separate transactions) and values of agencies of this size would increase.
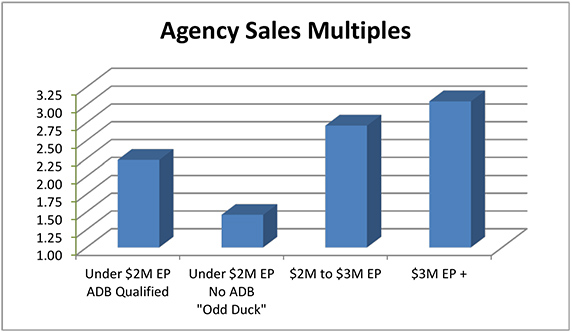
The chart above shows the average sales multiple for all purchase opportunities discussed in this edition of the AAVI, and the chart certainly drives a few points home:
- Agency Buyers love the opportunity to purchase a small sized agency (less than $2Million in EP), only if it qualifies for ADB.
- Agencies with over $2Million in Premium continue to sell for very healthy multiples and are not in need of assistance from the ADB program from a cash flow or valuation perspective.
- The “Odd Ducks” with Earned Premium from $1,500,001 to $1,999,999 hold the lowest value of all agency buy/sell opportunities.
All across the country, Allstate Agency Purchasers are turning down the opportunity to purchase a $1,500,001 to $1,999,999 Earned Premium agency (the “Odd Duck”) to purchase a small sized Allstate Agency with less revenue. They are doing this not because they prefer a business with less revenue, but because they view the ADB program as their gateway to growing their business beyond the “Odd Duck” purchase opportunity they turned down.
2. The Value of Agencies with over $2Million in Earned Premium Spiked Significantly
Agencies with Earned Premiums of $2Million to $3Million realized a multiple of 2.71 in the Third Quarter of 2015, a high that has not been realized since 2008. This increase in value is driven by Existing Agency Owners leveraging the equity in their existing agencies to make a strategic purchase at a very high multiple. When looking at the sales multiple for this size group excluding existing agency owners purchasing a satellite, the multiple paid by Outside Buyers is 2.45X – a value right in line with historical averages. As has been discussed in the past, a market that allows both Existing Agency Owners and Outside Buyers to make purchase offers is going to be good for Allstate Agency Values.
Agencies over $3Million in Premium sold for 3.05 times in the Third Quarter, an accomplishment that has also not been matched since 2008. This is especially impressive as the entire pool of Buyers were new to Allstate (Outside Buyers). Contributing to this gain in values is the exceedingly high number of very large agencies sold in the Third Quarter of 2015. In fact, 75% of the agencies transitioned in this size group were over $4Million in Earned Premium and an amazing 38% were over $5.0Million in total Earned Premium. Large agencies were certainly available for purchase in the Third Quarter of 2015, and agency buyers did not haggle over price.
| Percentage of Agency Sales by Size Group | ||||||||||||||||||||||||||||||||||||||||||||||||||||||||||||||||||||||||||||||||||||||||||||||||||||||||||||||||||||||||||||||||||||||||||||||||||||||||||||||||||||||||||||||||||||||
|
| Use the arrows to see agency values over time. | prev next |
It is worthy to note that 37% of agencies financed by PPC LOAN in the Third Quarter of 2015 had Earned Premium of less than $2Million. Historically, this number has been at or below 20%, and highlights the fact that PPC LOAN is more actively financing agencies that qualify for ADB. PPC LOAN has financed all sized agents since 2000, and our trend towards funding small book purchases indicates we are adaptive to the needs of the market.
| Allstate Agency Value Ratios | ||||||||||||||||||||||||||||||||||||||||||||||||||||||||||||||||||||||||||||||||||||||||||||||||||||||||||||||
|
| Use the arrows to see agency values over time. | prev next |
For those residing in a state where a good portion of the homeowners insurance is written through a third party brokerage company (primarily coastal counties), looking at the multiple of revenues may be your best measuring stick for agency value as it takes into consideration both Allstate and brokered (i.e. non-Allstate) revenues. Certainly, the brokerage book is a reliable source of renewal income and has a level of value that is not presented in the traditional multiple applicable to Allstate commissions.