Click the Green Editorial Tab Above!
Interest Rates Are Moving Up, How Does That Impact You? by PPCLOAN's Steven Kemper..
2014 Q3
Third Quarter 2014
The simple average for agency values has reached 2.66 times for the first time since 2008. Agency values for each agency size group are also up, as seen in the chart below. A deeper analysis of agency sales occurring in the Third Quarter of 2014 reveals that Existing Agency Owners purchasers are contributing greatly to this increase as their average buying multiple was 2.87 times for the Quarter.
| Allstate Agency Price to 12MM Earned Premium Ratio (National Average) | ||||||||||||||||||||||||||||||||||||||||||||||||||||||||||||||||||||||||||||||||||||||||||||||||||||||||||||||||||||||||||||||||||||||||||||||||||||||||||||||||||||||||||||||||||||||||||||||||||||||||||||||||||||||||||||||||||||||||||||||||||||||||||||||||||||||||||||||||||||||||||||||||||||||||||||||||||||||||||||||||||||||||||||||||||||||||||||||||||||||||||||||||||||
|
| Use the arrows to see agency values over time. | prev next |
There are two interesting discussion topics that have emerged during the Third Quarter of 2014. One supports the headline of agency values being up, and the other is simply interesting for the rarity of its occurrence. The two are described in more detail below:
1. Existing Agency Owners driving value increase with average satellite purchase at a 2.87 times multiple
Statistically speaking, the number of Existing Agency Owners consummating an agency purchase during the first Three Quarters of 2014 is significantly higher than the number of Existing Agency Owners who purchased a satellite during the same time period of 2013 – up more than 50%. Simply stated, with more Existing Agency Owners qualifying to purchase a satellite agency, the pool of “Approved Buyers” has increased in 2014, a trend that has resulted in a positive move for Allstate Agency Values.
This increase of Approved Buyers has allowed many sellers to receive a higher sales multiple as both Outside Buyer and Existing Agency Owner alike have made competing offers for an agency purchase. As is always the case, Existing Agency Owners must present a compelling business case to receive “Approved Buyer” status, which can include hitting various performance metrics and outlining growth strategies, along with presenting a comprehensive business plan.
It is especially worth noting that Existing Agency Owners typically come to the table with strong purchasing power, utilizing the equity in their existing business to secure high levels of financing. As a purchaser of agencies, Existing Agents paid far more than the average (or Outside Buyers for that matter), and they did it because they can. Let’s examine some of the “Why’s” for Existing Agency Owners who are seemingly paying a premium for a satellite purchase:
Don’t want to miss an opportunity
Many Existing Allstate Agency Owners around the country have voiced their desire for ownership of additional Allstate premium dollars. This significant desire to own additional Premium dollars is now an opportunity many top performing agents can execute on, and they are viewing the opportunity as “too good to pass up.” As a result, existing Allstate agents are making aggressive purchase offers when a quality buying opportunity presents itself, significantly contributing to this Quarter’s upward trend of agency values.
Strategic purchase
Many existing agents are making a top dollar offer to purchase a satellite because it gives them a greater presence in a desired market area. Having a larger geographic footprint, along with greater access to commission dollars, makes it easier to substantiate the deployment of resources for the purpose of agency growth.
Additional profit is gravy, not necessity
Beyond just their desire to purchase additional premium dollars, existing Allstate Agency Owners are in a unique buying position as they simply are able to pay more for a purchase than your typical outside buyer. Utilizing the equity in their existing agency contributes to an agent’s purchasing power, something an Outside Buyer does not have at his or her disposal.
In most instances, an existing Allstate agency owner is providing for their personal living needs from the cash flow of their existing agency, and any profits from a satellite purchase simply represents “gravy.” This is not the case with Outside Buyers, as they typically need every dollar of cash flow to support their personal living obligations and pay business overhead, along with business purchase loan payments.
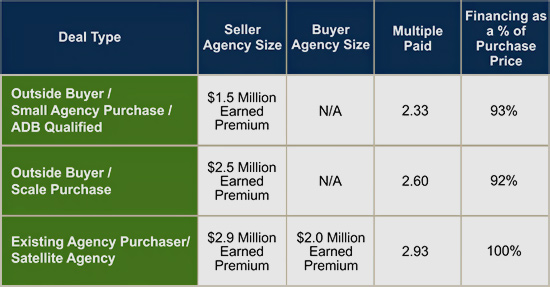
For further analysis of this topic I invite you to take a look this Quarter’s Editorial which is titled “How Deals Get Done.” In this editorial I examine the various types of acquisition opportunities we see and the financing package that are put together to make these deals work. The Editorial includes an analysis of Outside Buyers and Existing Agency Owners, along with agencies qualifying for ADB and those at scale.
2. No merger transactions in the Third Quarter of 2014
Since I began tracking the nature of an agency transaction back in 2008 (satellite purchase, merger or split agency), this is the first quarter I have on record where PPC LOAN was not asked to participate in the financing of a merger transaction. I will continue to watch and report on merger activity going forward. Certainly, the lack of merger activity has not adversely affected the value of agencies.
| Percentage of Agency Sales by Size Group | ||||||||||||||||||||||||||||||||||||||||||||||||||||||||||||||||||||||||||||||||||||||||||||||||||||||||||||||||||||||||||||||||||||||||||||||||||||||||||||||||||
|
| Use the arrows to see agency values over time. | prev next |
During the First Quarter of 2014, larger-sized agencies with new and renewal commission income of $300,000 or greater represented only 21% of agencies sold during the Quarter. During the Second and Third Quarters of 2014, these largest sized agencies represented more than 50% of the total.
With larger-sized agencies selling for the largest multiples, the simple average has increased during the Second and Third Quarter of 2014, as agencies with more than $300,000 in New and Renewal Commission income represented a larger percentage of total sales. This trend reminds us of the importance of focusing on the sales multiple for each size group.
| Allstate Agency Value Ratios | ||||||||||||||||||||||||||||||||||||||||||||||||||||||||||||||||||||||||||||||||||||||||||||||||||
|
| Use the arrows to see agency values over time. | prev next |