Click the Green Editorial Tab Above!
Interest Rates Are Moving Up, How Does That Impact You? by PPCLOAN's Steven Kemper..
2013 Q3
Third Quarter 2013
Allstate Agency Values Hit Four-Year High
The simple average of Allstate agencies transitioned in the Third Quarter of 2013 was 2.50, a benchmark that has not been accomplished since the Second Quarter of 2009 when the average multiple was also 2.50 times. So what is driving this four-year high in Allstate Agency Values?
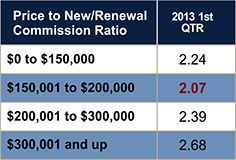
- Desirability of the Outside Buyer Test Program – Buyers are seeing opportunities in this program not only in the form of heightened commission income available, but also in the underlying competitiveness of the product they are selling. Those books sold with Earned Premium of $1.5 Million or less (hence qualifying for enhanced commission) sold at a multiple of 2.24X – a strong multiple rarely received by the smallest of agencies. Historically, smaller sized agencies have dragged the average multiple down, so the Test Program has been significant in increasing the overall simple average multiple.
- Large agencies viewed as more desirable than ever – Who wouldn’t want to own an Allstate agency with $400,000 in commission income and a profit margin in excess of 50%? The economics of these sized agencies makes them attractive to entrepreneurs and the relative scarcity of these agencies on the market has helped to ensure their value remains high. Books over $3 Million in Earned Premium increased from a 2.57 sales multiple in the Second Quarter to 2.68 times in the Third Quarter of 2013.
I note from analyzing the pool of Allstate agencies sold in the 3rd Quarter that books above $1.5 Million and below $2.0 Million in Earned Premium sold for an average multiple of just 2.07 times. This is below the 2.24 multiple paid for agencies with Earned Premium below $1.5 Million, and is likely driven by these sized agencies ($1.5 Million to $2.0 Million in Earned Premium) not qualifying for the Outside Buyer Test Program / Enhanced Commission.
What these numbers tell me is that agency buyers see greater opportunity in purchasing a $1,400,000 Earned Premium agency that qualifies for enhanced commissions, over purchasing a $1,700,000 Earned Premium agency that does not qualify for enhanced commissions.
It is worthy to note that once the Earned Premium of the agency being purchased exceeds $2.0 Million, multiples appear not to be affected by the absence of Enhanced Commissions and are selling at multiples in-line or even above historical levels.
| Allstate Agency Price to 12MM Earned Premium Ratio (National Average) | ||||||||||||||||||||||||||||||||||||||||||||||||||||||||||||||||||||||||||||||||||||||||||||||||||||||||||||||||||||||||||||||||||||||||||||||||||||||||||||||||||||||||||||||||||||||||||||||||||||||||||||||||||||||||||||||||||||||||||||||||||||||||||||||||||||||||||||||||||||||||||||||||||||||||||||||||||||||||||||||||||
|
| Use the arrows to see agency values over time. | prev next |
| Allstate Agency Value Ratios | ||||||||||||||||||||||||||||||||||||||||||||||||||||||||||||||||||||||||||||||||||||||
|
| Use the arrows to see agency values over time. | prev next |