Click the Green Editorial Tab Above!
Interest Rates Are Moving Up, How Does That Impact You? by PPCLOAN's Steven Kemper..
2010 Q4
Fourth Quarter 2010
As noted in the Third Quarter 2010 Allstate Agency Value Index Report, trends in the US Economy left analysts guardedly optimistic. Now that 2010 is complete, the year in review reveals a strong finish in the fourth quarter of 2010. Tax rates were not increased on any American and the Dow Jones and S&P 500 both finished the year with greater than 10% growth. However, there is still work to be done as we continue dealing with what appears to be a “jobless recovery” matched with historic levels of national debt.
Allstate Agency Values – Continued Stabilization
The Fourth Quarter 2010 Allstate Agency Value Index has resulted in little change to the value of Allstate Agencies — as very little changed during this period. Outside buyers continue to dominate the purchaser pool, and all 14 Allstate designated regions remained consistent in their policy and approach to transitions.
Regions that have been aggressively approving the purchase and merger of multiple agencies throughout the first three quarters of 2010 continued to do so in the fourth quarter. Likewise, those regions with a more conservative approach to agency transitions did not change their strategy as 2010 concluded.
| Allstate Agency Price to 12MM Earned Premium Ratio (National Average) | ||||||||||||||||||||||||||||||||||||||||||||||||||||||||||||||||||||||||||||||||||||||||||||||||||||||||||||||||||||||||||||||||||||||||||||||||||||||||||||||||||||||||||||||||||||||
|
| Use the arrows to see agency values over time. | prev next |
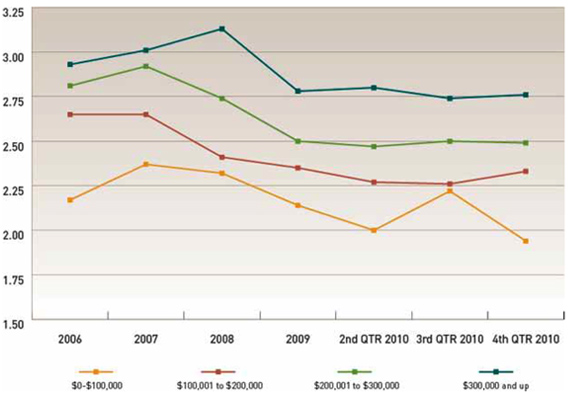
Agency Analysis by Size Group
$0 to $100,000 in Renewal Commissions
Agencies in this size group realized a sharp fourth quarter drop from 2.22 times to 1.94 times renewal commission income. There was also a decrease in the number of merger transactions involving smaller agencies. In some instances, outside buyers were given the opportunity of purchasing and merging books of a larger class size — an additional factor explaining the drop in agency values.
As noted in prior reports, buyers who had the opportunity to merge their newly acquired agency into their existing location experienced significant improvement in cash flow, as a result of the elimination of duplicative costs. They were also willing to pay more for an agency that would be purchased and merged than they were for an agency that would be purchased and maintained as a satellite location.
Clearly the prospects for improved value multiples for Allstate agencies in this size range in 2011 is highly dependent upon the agency transition policy/strategy of the Allstate regions with regard to mergers. Robust merger activity will result in increased values while continued curbs on merger activities will likely result in flat to downward trending multiples.
$100,000 to $200,000 in Renewal Commissions
It seems prices for this size group stabilized, as agencies experienced an increase in value multiple during the fourth quarter and ended on a year high. The stronger showing in this size group, relative to that of the $100,000 and under group, reflects continued buyer preference for larger agencies, and a slightly larger volume of acquisition/merger transactions.
$200,000 to $300,000 in Renewal Commissions
Agencies with $200,000 to $300,000 in renewal commission income tend to gravitate towards an average value of 2.50 times renewal commission income in the fourth quarter.
Here again the evidence of the buyers’ preference for larger Allstate agencies is on clear display, as they offer their new owners ample cash flow to cover routine operating costs, their own living wage needs and agency acquisition debt servicing costs wtih plenty to spare for investments in organic growth initiatives.
$300,000+ in Renewal Commissions
Agency values in this size group continued to hold strong at approximately 2.75 times renewal commission income. The fourth quarter brought an end to the negative trend this size group realized over the previous two quarters.
The multiple for which agencies in this size class were sold during the fourth quarter is made even more impressive given the fact that the vast majority of the buyers were first time purchases (outside buyers). Should the buyer pool expand in 2011 to include more existing agency owners, this should further stabilize or even increase the values for which larger Allstate agencies are sold in the future.
| Allstate Agency Value Ratios | |||||||||||||||||||||||||||||||||||||||||||||||||||||
|
| Use the arrows to see agency values over time. | prev next |